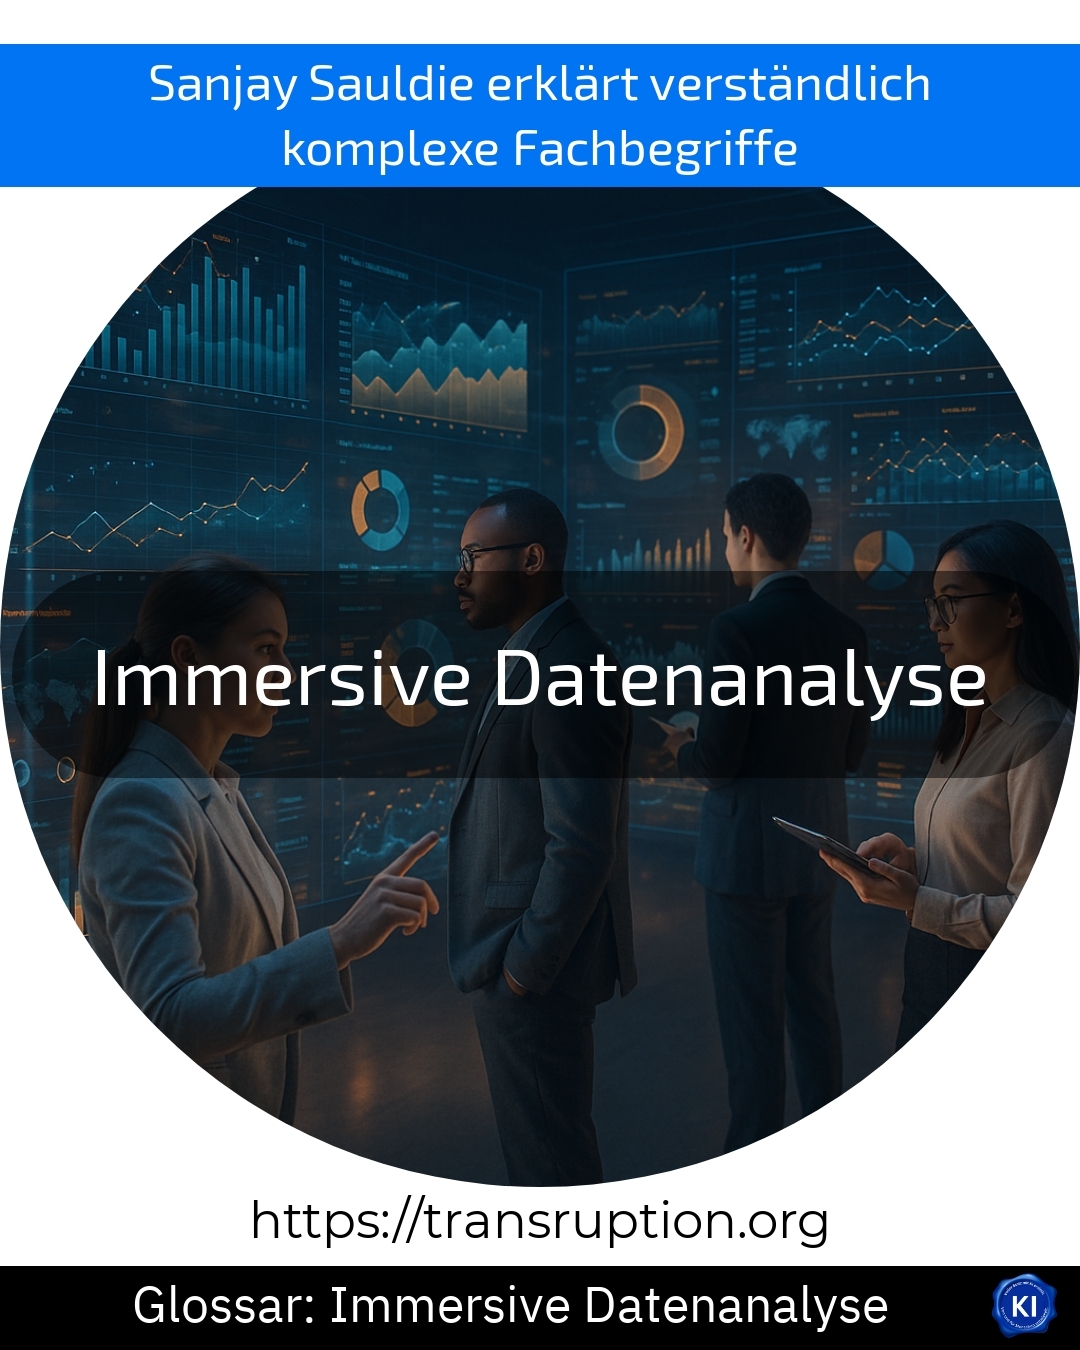
Immersive data analysis is primarily used in the categories of big data and smart data, artificial intelligence and virtual and augmented reality. The term describes a new, particularly vivid form of data analysis in which data can be experienced in three dimensions using modern technology such as virtual reality (VR) or augmented reality (AR).
Instead of just seeing figures and graphics on the screen, users can immerse themselves in virtual data worlds. This allows large and complex amounts of data to be captured and understood much more intuitively. With specially developed glasses or projection systems, users can move through interactive diagrams, recognise trends better and grasp correlations more easily.
An illustrative example: In a manufacturing company, management wants to identify bottlenecks in the supply chain. With the help of immersive data analysis, the team can experience the entire process as a walk-through, virtual 3D landscape. Delayed deliveries, production stoppages or unreliable suppliers become visible at a glance. As a result, decisions can be made much faster and on a more informed basis.
Immersive data analysis thus offers companies an innovative way to not only see data, but to really understand it.
