The term visualisation of knowledge graphs is particularly at home in the fields of artificial intelligence, big data, smart data and digital transformation.
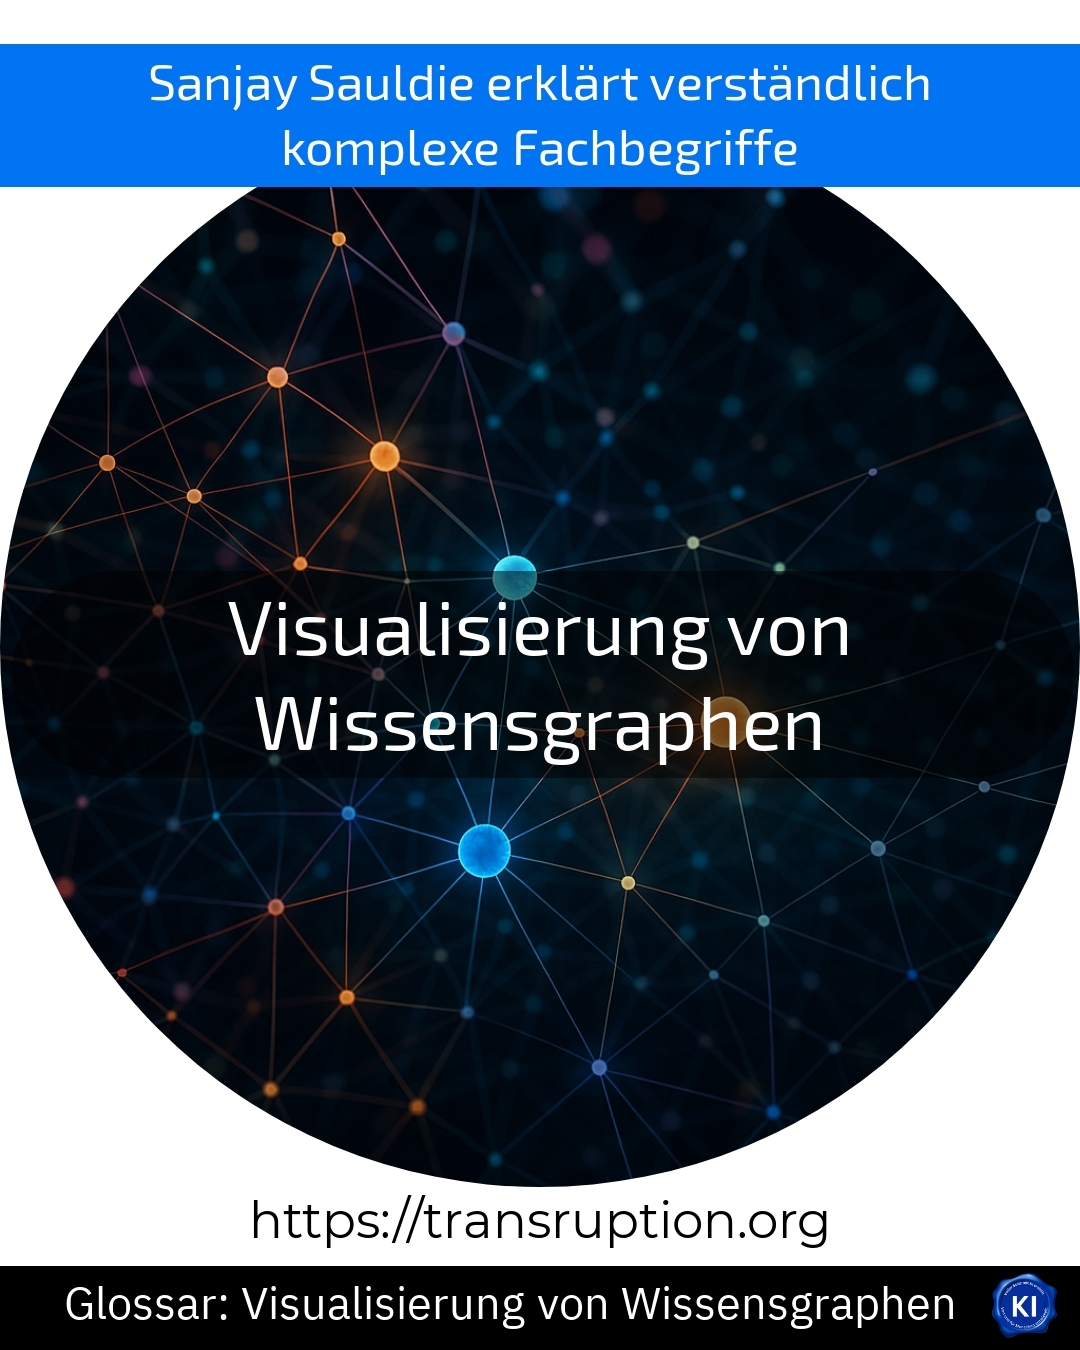
A visualisation of knowledge graphs means that complex connections and relationships between different data are represented graphically. A knowledge graph is like a network: different pieces of information (e.g. people, companies or terms) are represented as so-called nodes, which are connected to each other by lines (edges) if they are related to each other.
Imagine you want to find out how different departments in your organisation work together. With a visualisation of knowledge graphs, you could see which teams communicate frequently and where there is less exchange. This helps you to quickly recognise correlations and make optimisations.
The visualisation of knowledge graphs enables a quick overview and supports well-founded decisions, especially with the large amounts of data that arise in modern companies. Visualisation tools help to reveal even hidden patterns that are easily overlooked in traditional tables.
